The Bayonne treaties are amazingly precise on the distances between the bordermarkers. Let’s focus on the array bm354-359. The treaty mentions:
bm354-355: 135m
bm355-356: 1058m
bm356-357: 710m
bm357-358: 602m
bm358-359: 330m
How was this measuring in the field done in the 19th century? Well, probably with a simple instrument called “chains”. If we google on surveyal-instruments on distance measuring, this is the dominant type.

The big question: can we reproduce the above distances in a consistent way using digital tools like the elevation profile in Google Earth or using precise Digital Elevation Models (DEM) in other software?
As you know, I have serious doubts about the correct location of the current bordermarkers bm358 and 358 and thus the yet to find original bm359. Remember: all bordermarkers from bm333 to 407 were replaced in the 1950-ies because they had all disappeared since the 19th century. I posted already on this subject before. The distances mentioned in the Treaty can help us to test my hypothesis.
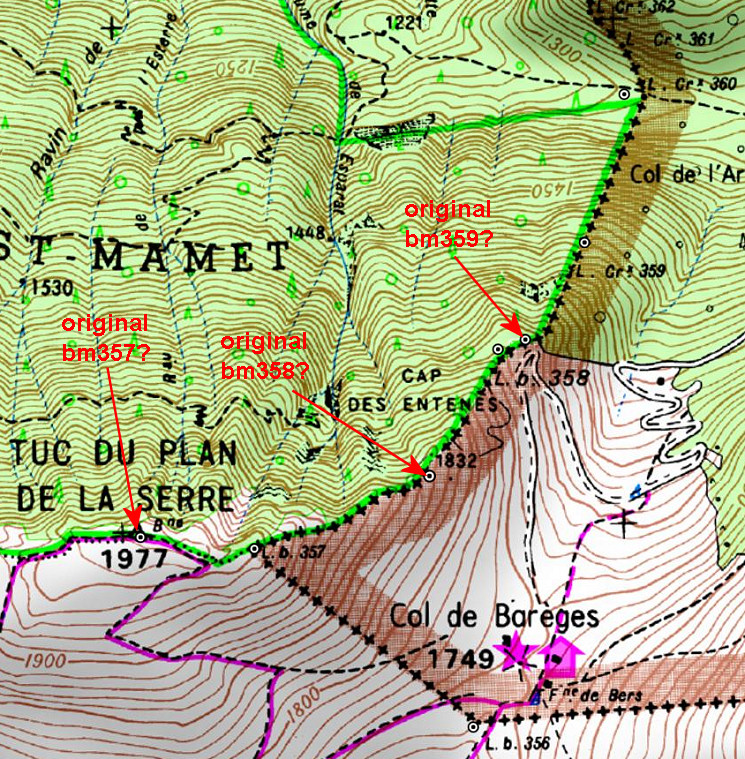
The position of the three bm’s 354-355-356 are in my opinion indisputable. If we reproduce digitally their distances in between in a convincing way, then we can check if bm357 and 358 were placed on the right spots.
The easiest way is with Google Earth, using the elevation profile of the borderline between the bordermarkers. That gives the distances between the bm’s taking in account the elevation in between. But GE uses different DEM’s: whatever is available en most precise. So different stretches of the borderline can use different DEM’s, we just don’t know which one. And more disturbing: the profile-diagrams often show artefacts: unexplainable shifts:

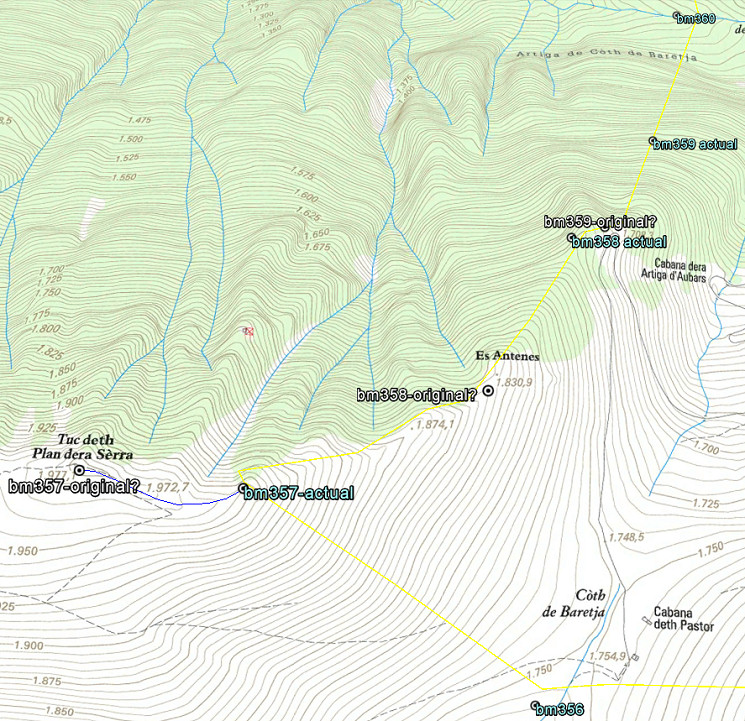
A more consistent approach (but not necessarily more precise qua resolution) is using altitudes from NASA SRTM1-data (downloaded with DEM1) and assigned to the gpx-tracks with GPS-Track-Analyse.NET. Let’s show the results on a map:
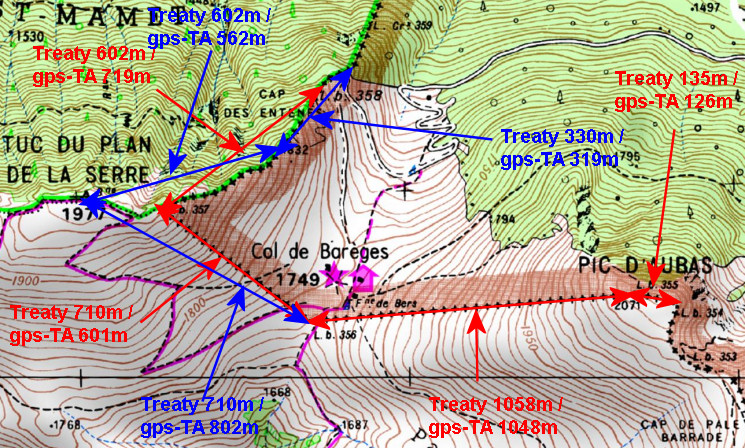
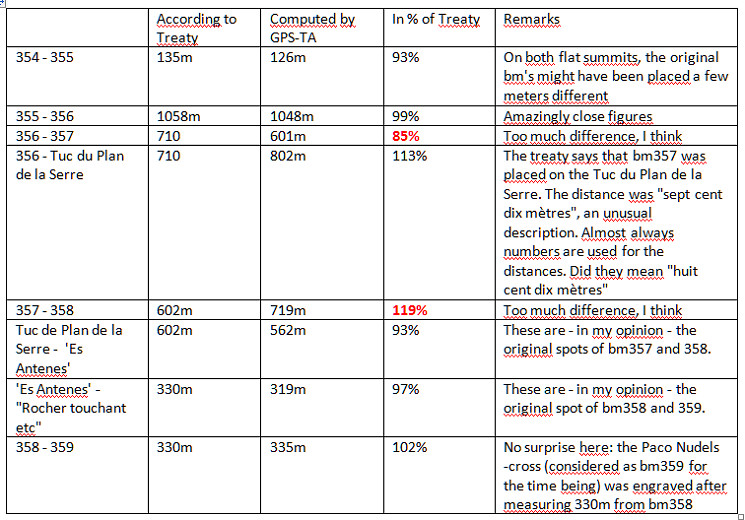
The red arrows and numbers refer to the distances between the existing bordermarkers. The blue arrows and numbers show the measurements of my hypothesis. As you can see: they make much more sense. To finish: a table with all computations and remarks:
